
STKLY
Market Vision
//
Loading chart...
Loading chart...
“Our mean reversion analysis identified OBM as a strong buy candidate. The alert triggered based on multiple technical indicators including MACD Bullish Crossover (12/26/9) and MACD Bullish Crossover (8/21/6) among others. Investors who acted on this STKLY alert would have seen their investment grow by 52.9% in just 33 days, turning every $1,000 into $1529.”
Our MACD & MEAN R. alerts identified OBM on August 8, 2025 before it gained +52.9%
“STKLY Mean Reversion alert predicted 52.9% gain in OBM”
August 8, 2025
to September 10, 2025
33
$0.70
$1.07
Identified a Double Bottom pattern with 88% confidence, indicating bullish momentum.
A Double Bottom pattern is identified with two distinct valleys at similar price levels, indicating a potential reversal from a downtrend to an uptrend.
The Double Bottom pattern suggests a bullish reversal. The price is likely to rise towards the target price of 0.85, breaking the resistance level of 0.735. This pattern is strengthened by increasing volume on the second bottom, indicating strong buying interest.
Analysis Period: August 8, 2025 - September 10, 2025
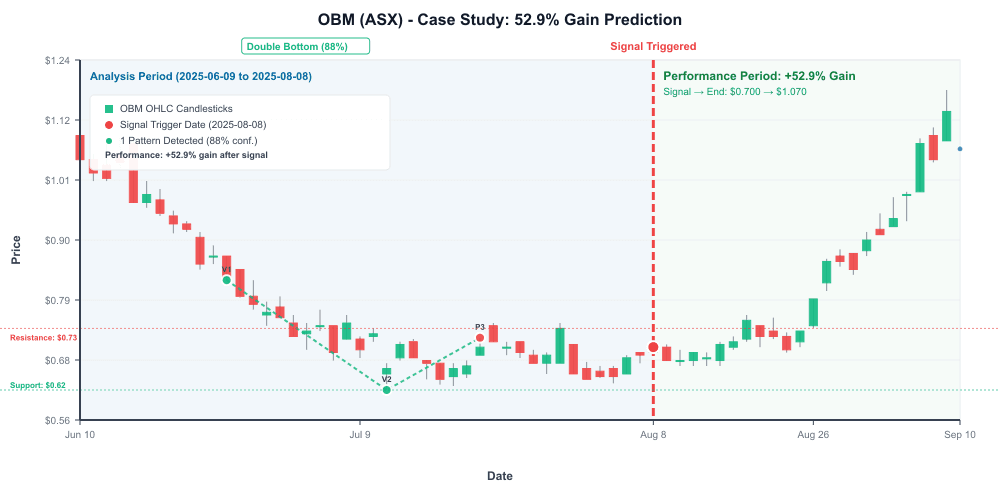
Chart shows historical price data for the analysis period. The red marker indicates when the STKLY alert was triggered. Chart pre-generated and served from CDN for optimal performance.
Start receiving similar alerts to identify opportunities before major price movements.
STKLY Confidence represents our algorithm's assessment of how likely an alert will result in a profitable trade based on:
Confidence scores above 70% indicate strong historical precedent for profitable outcomes.
Disclaimer: This case study is provided for educational purposes only and should not be considered as investment advice. Past performance is not indicative of future results. All investments carry risk of loss. Always conduct your own research and consider consulting with a qualified financial advisor before making investment decisions.
© 2025 STKLY Market Vision. All rights reserved.